Accuracy is often the first metric people check when evaluating machine learning models, but it doesn’t tell the full story. Depending on whether you're dealing with regression or classification, different metrics provide deeper insights into your model's performance.
Let’s explore the most important evaluation metrics and when to use them.
Regression Metrics: Measuring Continuous Predictions
For regression models, we predict continuous values (e.g., predicting house prices or sales revenue). The goal is to measure how far off our predictions are from the actual values.
Mean Absolute Error (MAE)
MAE=1nn∑i=1|yi−ˆyi|
Pros:
- Easy to interpret (average absolute difference).
- Treats all errors equally.
Cons:
- Doesn't differentiate between small and large errors.
- May not be ideal when large errors should be penalized more.
When to use:
- When you need a simple, interpretable metric.
- When all errors should be treated equally.
Mean Squared Error (MSE)
MSE=1nn∑i=1(yi−ˆyi)2
Pros:
- Penalizes larger errors more than MAE (useful when large deviations matter).
- Differentiable, making it easier to optimize in gradient-based models.
Cons:
- Sensitive to outliers (a few large errors can dominate).
When to use:
- When large errors should be penalized more heavily.
- When using models that benefit from differentiability (e.g., neural networks).
Root Mean Squared Error (RMSE)
RMSE=√MSE=√1nn∑i=1(yi−ˆyi)2
Pros:
- Easier to interpret than MSE since it’s in the same units as the target variable.
Cons:
- Still sensitive to outliers.
When to use:
- Same cases as MSE, but when interpretability in the original unit is needed.
R-Squared (R2)
R2=1−∑(yi−ˆyi)2∑(yi−ˉy)2
Pros:
- Measures how well the model explains variance in the data.
- Values range from 0 to 1 (higher is better).
Cons:
- Can be misleading in non-linear relationships.
- A high R2 doesn't mean the model is correct.
When to use:
- When you need a general goodness-of-fit metric.
- When comparing models.
Mean Absolute Percentage Error (MAPE)
MAPE=1nn∑i=1|yi−ˆyiyi|×100
Pros:
- Expressed as a percentage (easy to understand).
Cons:
- Can be skewed by small actual values (division by small numbers inflates error).
When to use:
- When percentage errors matter more than absolute errors.
Classification Metrics: Evaluating Categorical Predictions
For classification models, we predict discrete classes (e.g., spam vs. not spam). Accuracy alone isn’t enough, especially with imbalanced datasets.
Accuracy
Accuracy=TP+TNTP+TN+FP+FNPros:
- Easy to understand.
- Works well for balanced datasets.
Cons:
- Misleading in imbalanced datasets (e.g., 99
When to use:
- When class distribution is balanced.
Precision
Precision=TPTP+FP
Pros:
- Answers "How many of the positive predictions were correct?"
- Useful when false positives are costly (e.g., fraud detection).
Cons:
- Doesn't account for false negatives.
When to use:
- When false positives matter more than false negatives (e.g., medical diagnosis).
Recall (Sensitivity, True Positive Rate)
Recall=TPTP+FN
Pros:
- Answers "How many actual positives were correctly identified?"
- Useful when false negatives are costly (e.g., missing a cancer diagnosis).
Cons:
- Doesn't consider false positives.
When to use:
- When missing positive cases is worse than flagging some incorrect ones.
F1-Score
F1=2×Precision×RecallPrecision+Recall
Pros:
- Balances precision and recall.
- Works well for imbalanced datasets.
Cons:
- Harder to interpret than accuracy.
When to use:
- When both false positives and false negatives matter.
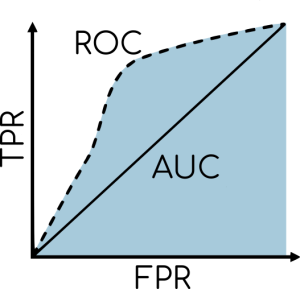
AUC-ROC (Area Under the Curve - Receiver Operating Characteristic)
- AUC (Area Under Curve) measures overall model performance across all classification thresholds.
- ROC Curve plots True Positive Rate (Recall) vs. False Positive Rate at different thresholds.

Pros:
- Helps compare models regardless of threshold.
- Works well for imbalanced datasets.
Cons:
- Can be misleading if classes are highly skewed.
When to use:
- When evaluating a model’s discriminative ability.
- When threshold selection matters (e.g., risk scoring models).
Conclusion: Metrics Matter!
No single metric tells the full story. Always choose the right metric for the problem at hand, especially for imbalanced datasets.


0 Comments